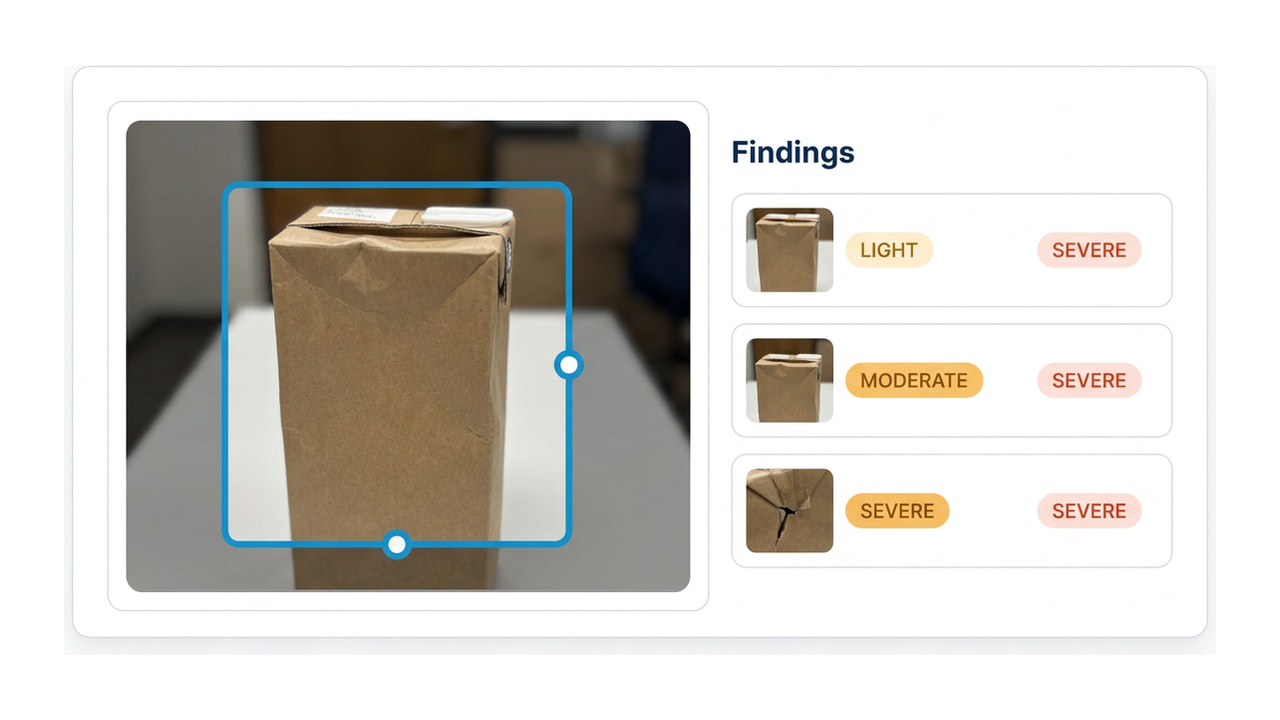

Detection examples
What it finds, photo by photo
Every photo below has been through the same endpoint the demo uses. The boxes, the severity grades and the wording are exactly what came back — nothing here was written by hand or picked for a second attempt.
Real analysis, recreated photographs
The photographs are recreations, not customer freight, so nobody’s shipment or labelling is on display here. The analysis is not a recreation: each report is the unedited response from the live pipeline, captured in one pass. To see it on freight of your own, use the demo — same endpoint, about thirty seconds.
17 photos · 25 findings · 25 located on the image. Select any photo for the full report.
Why most of these are “moderate”
Severity is graded per finding, by what the warehouse has to do about it rather than by how dramatic the photograph looks. A crushed carton under intact wrap is moderate — one unit affected, load stable, ordinary single-unit claim. Severe is reserved for damage whose consequence reaches past the unit it sits on: a collapsed stack, a shifted load, a breach spilling product across a container. That distinction is what keeps a severity alert worth reading.
Every finding also carries a bounding box as fractions of the image, which is what the overlay draws. If you are integrating rather than reading, the API documentation gives the field-by-field contract.
Now run it on something of your own
The demo returns exactly this structure on whatever you upload. No sign-up, and no sales call first.